Performance Optimisation of JavaScript Applications & Charts
I started programming a long while ago, in 1987 I wrote my first lines of code in Basic on a […]
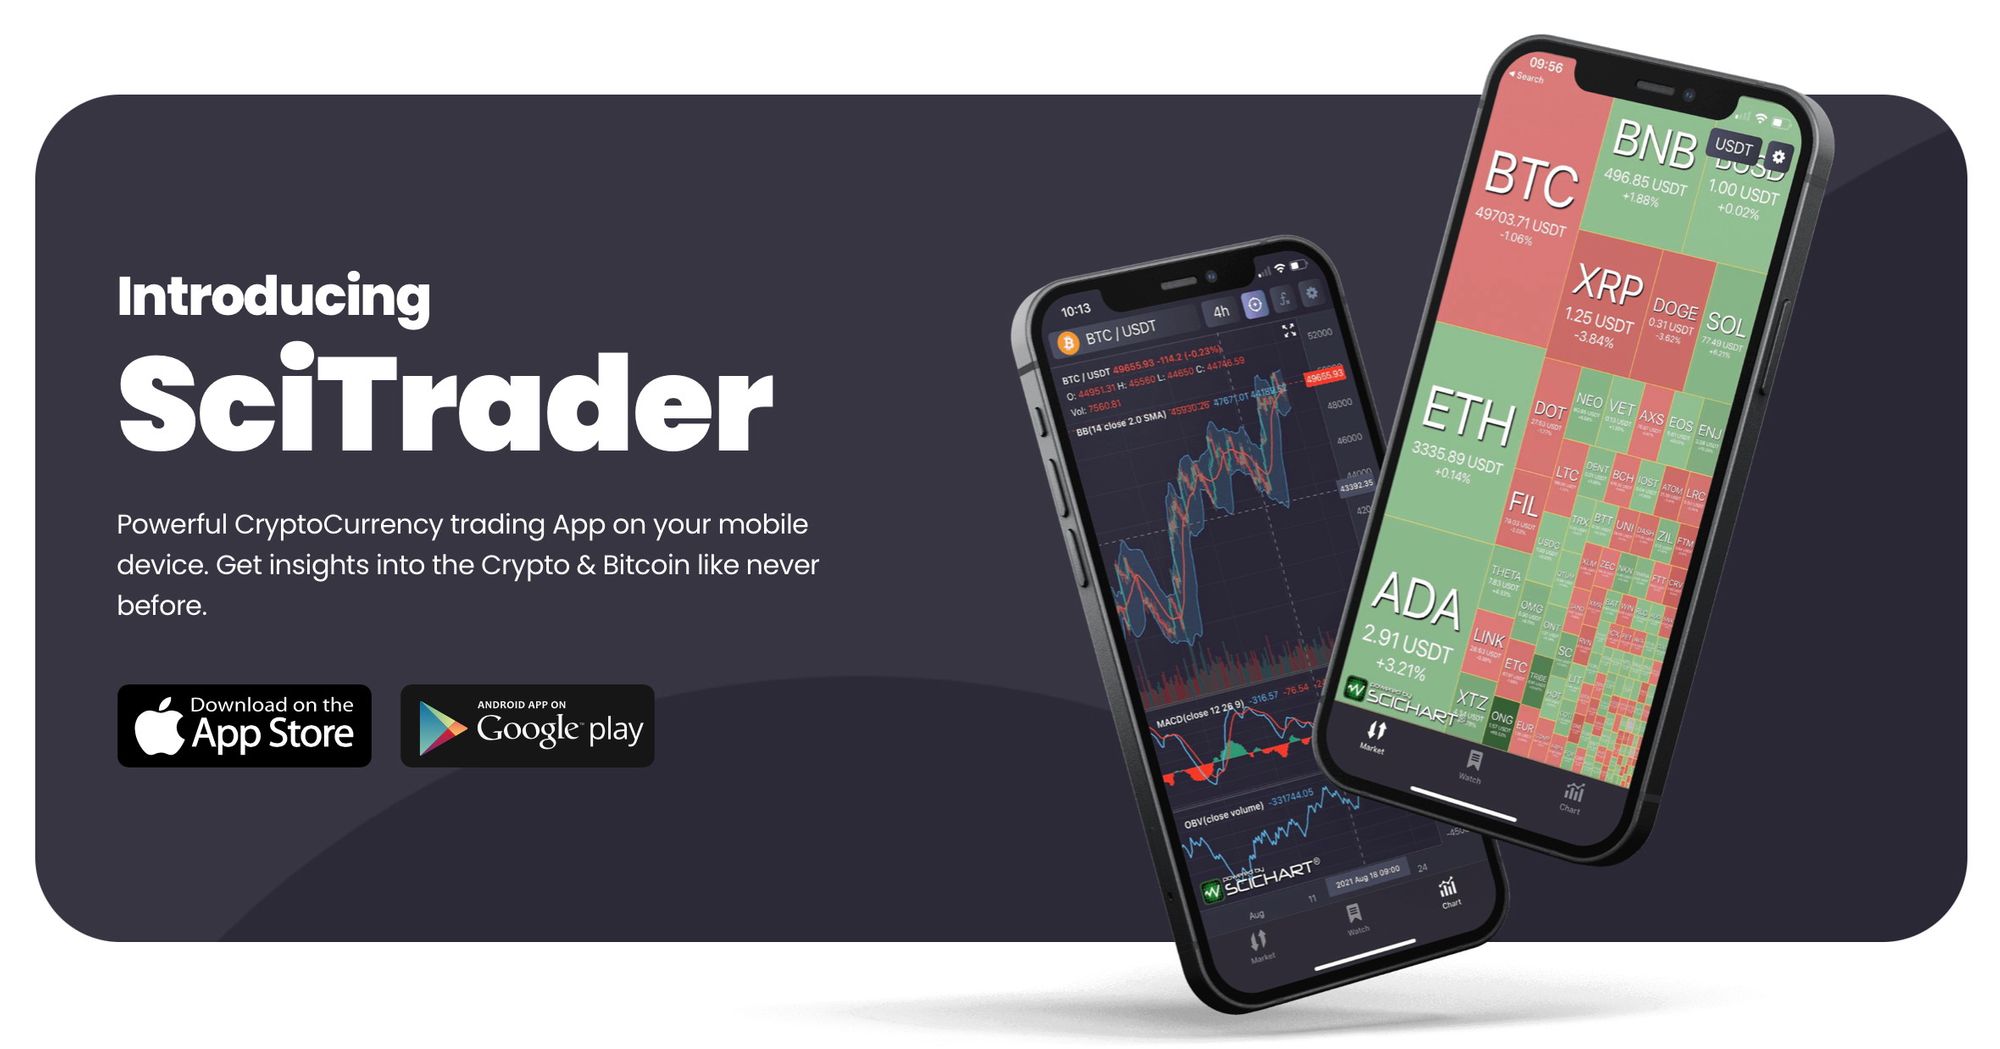
Earlier this year blogged that we were creating a financial charting component for use when developing mobile iOS/Android cryptocurrency or stock trading applications.
Well we’ve gone one further than that! We’ve created an entire iOS/Android app, a new website and a sister company – SciTrader.io.
Let’s take a quick look through the features of the app.
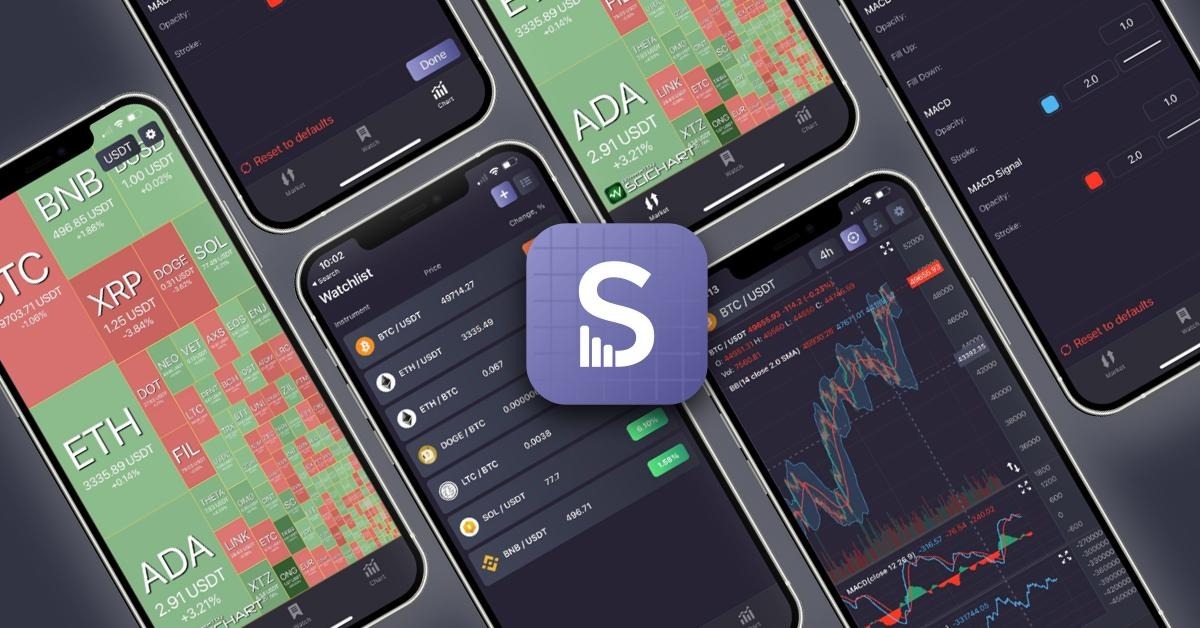
The first feature in the SciTrader App is the Altcoin heatmap, which we call the Market Overview Heatmap. This is a native iOS/Android Treemap control which displays around 800 Altcoins in the crypto market and visualizes their strength vs. USD, Bitcoin or Ethereum.
The size of the tile in the Market Overview Heatmap is the relative volume traded in the past 24-hours. The colour of the tile is the relative percentage move to the underlying (USD, BTC, ETH) in the past 24-hours. Tapping the button in the top-right and choosing BTC or ETH shows the relative strength vs. Bitcoin or Ethereum which lets you spot top movers in the crypto market.
Long pressing a tile pops up a menu, where you can add to watchlist or open a chart.
Of course, the real feature we want to showcase in the SciTrader App is the financial chart control.
Using Swift & Kotlin, and the underlying SciChart iOS/Android chart libraries, we’ve built a dedicated financial chart component. Supporting up to 20 technical indicators, derivatives of indicators (e.g. Moving Average on Relative Strength), cursors, automatic pane management, resizing panes, legends, zooming, panning and real-time data updates, this chart component makes creating native trading apps easy. Take a look below at how it looks.
Of course, you can try it out for yourselves, by getting the app below:
As well as a fully-featured Crypto Trading App, we’re in the process of packaging the SciTrader SDK For financial trading charts with technical indicators as an add-on to SciChart. Initially this will be iOS & Android only, but we’re building a JavaScript version too.
Let’s dig into the SDK to see what this brings you in addition to vanilla SciChart.
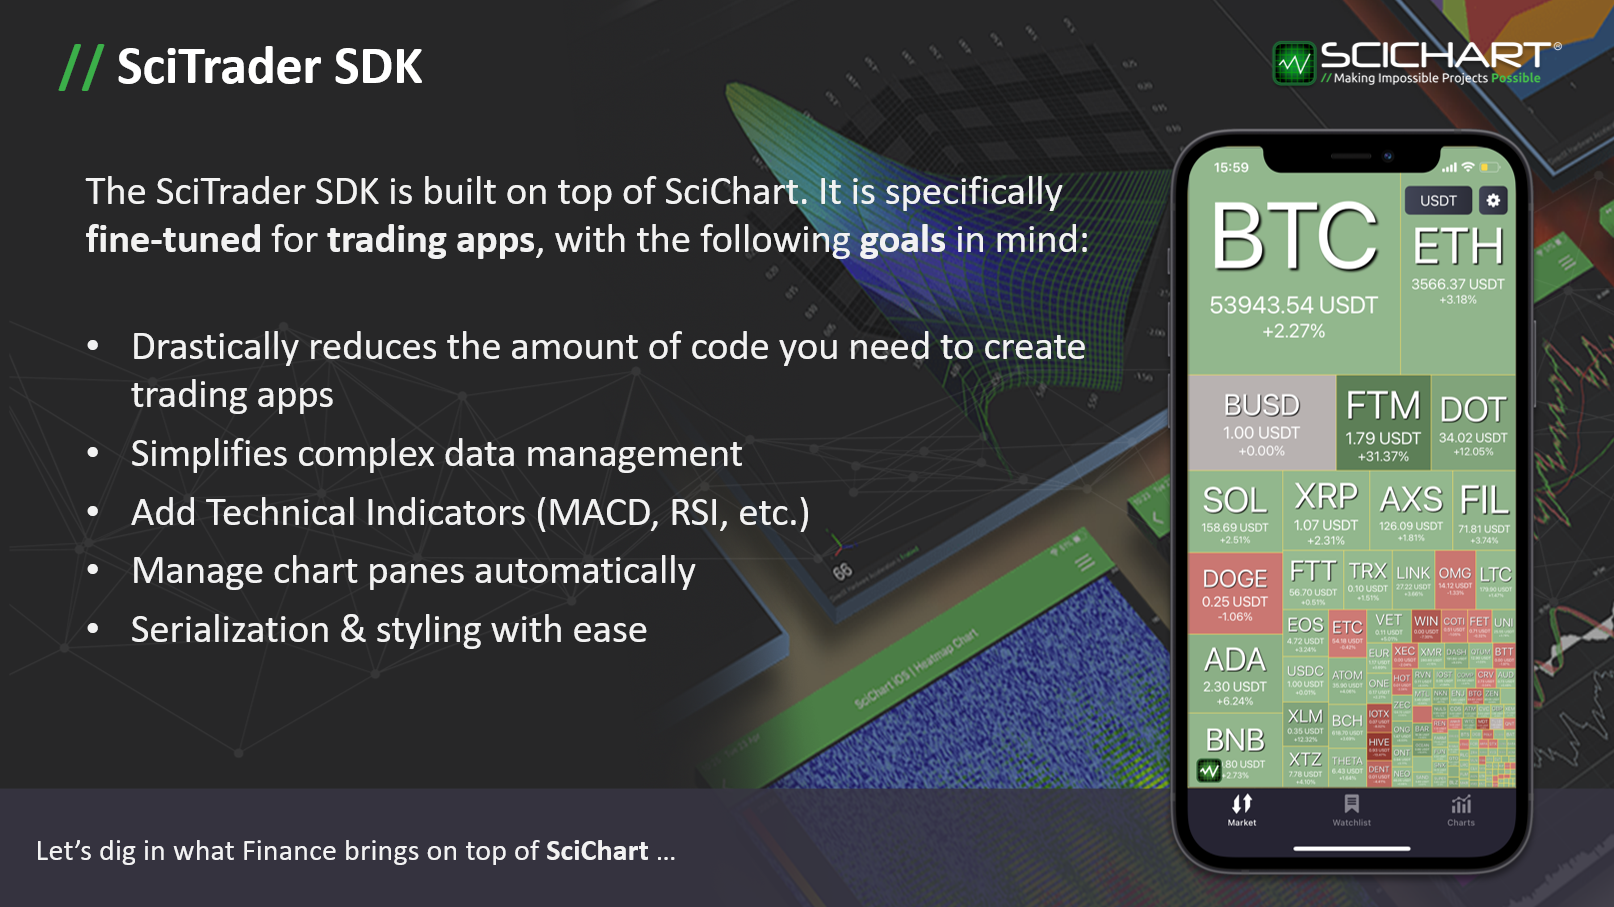
The SciTrader SDK is built on top of SciChart. It is specifically fine-tuned for trading apps, with the following goals in mind:
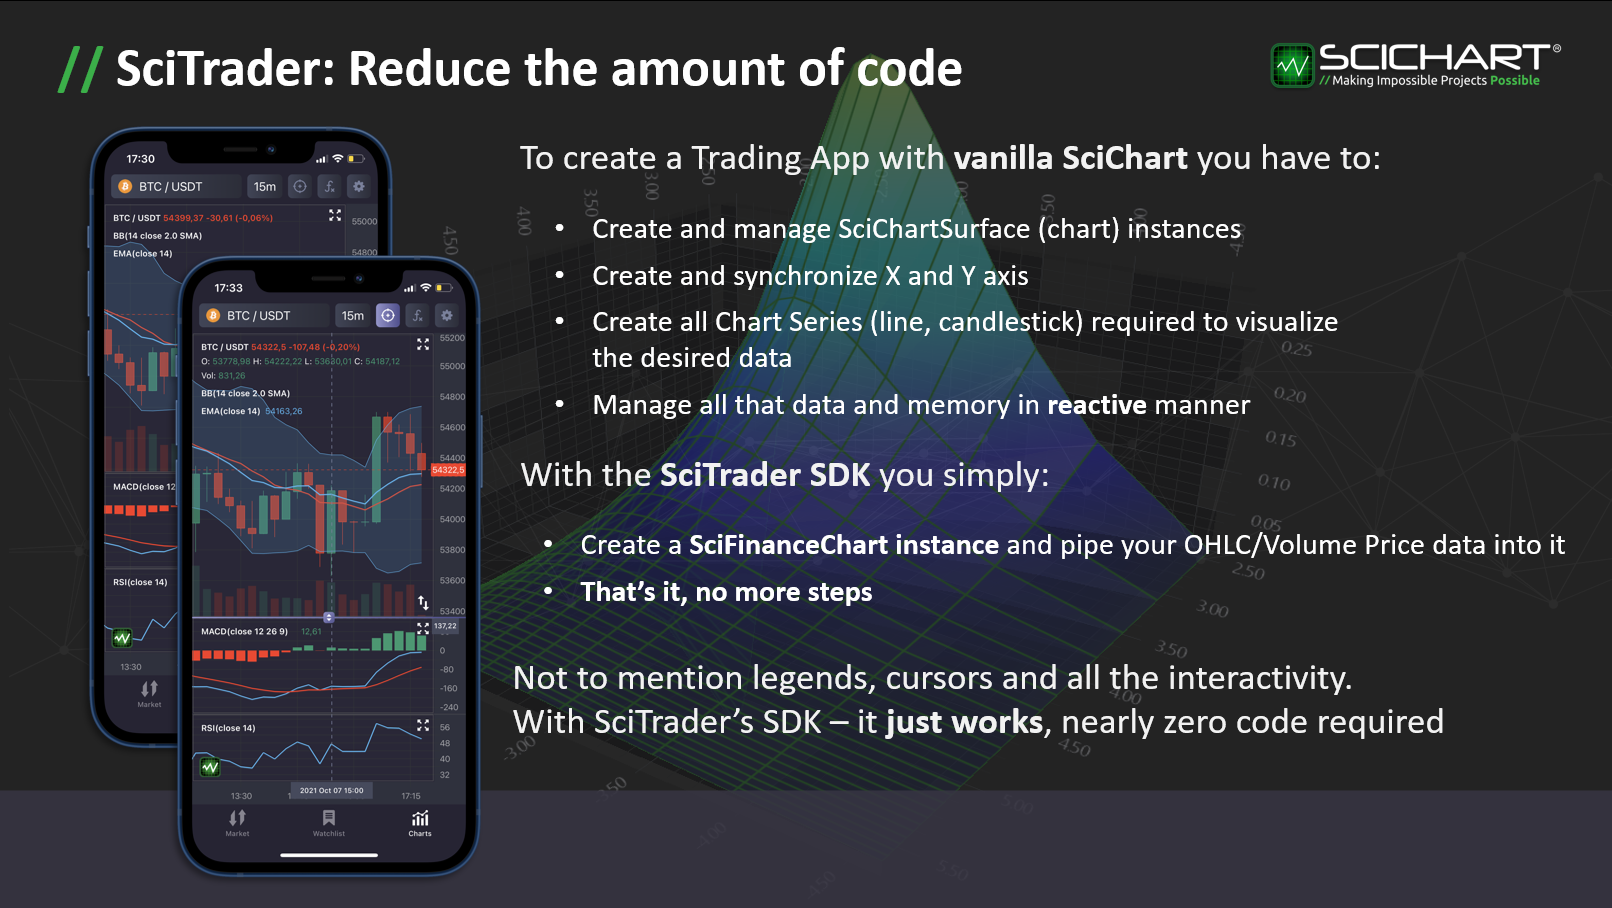
To create a Trading App with SciChart you have to:
With the SciTrader SDK you simply:
Not to mention legends, cursors and all the interactivity. With the SciTrader SDK – it just works, nearly zero code required
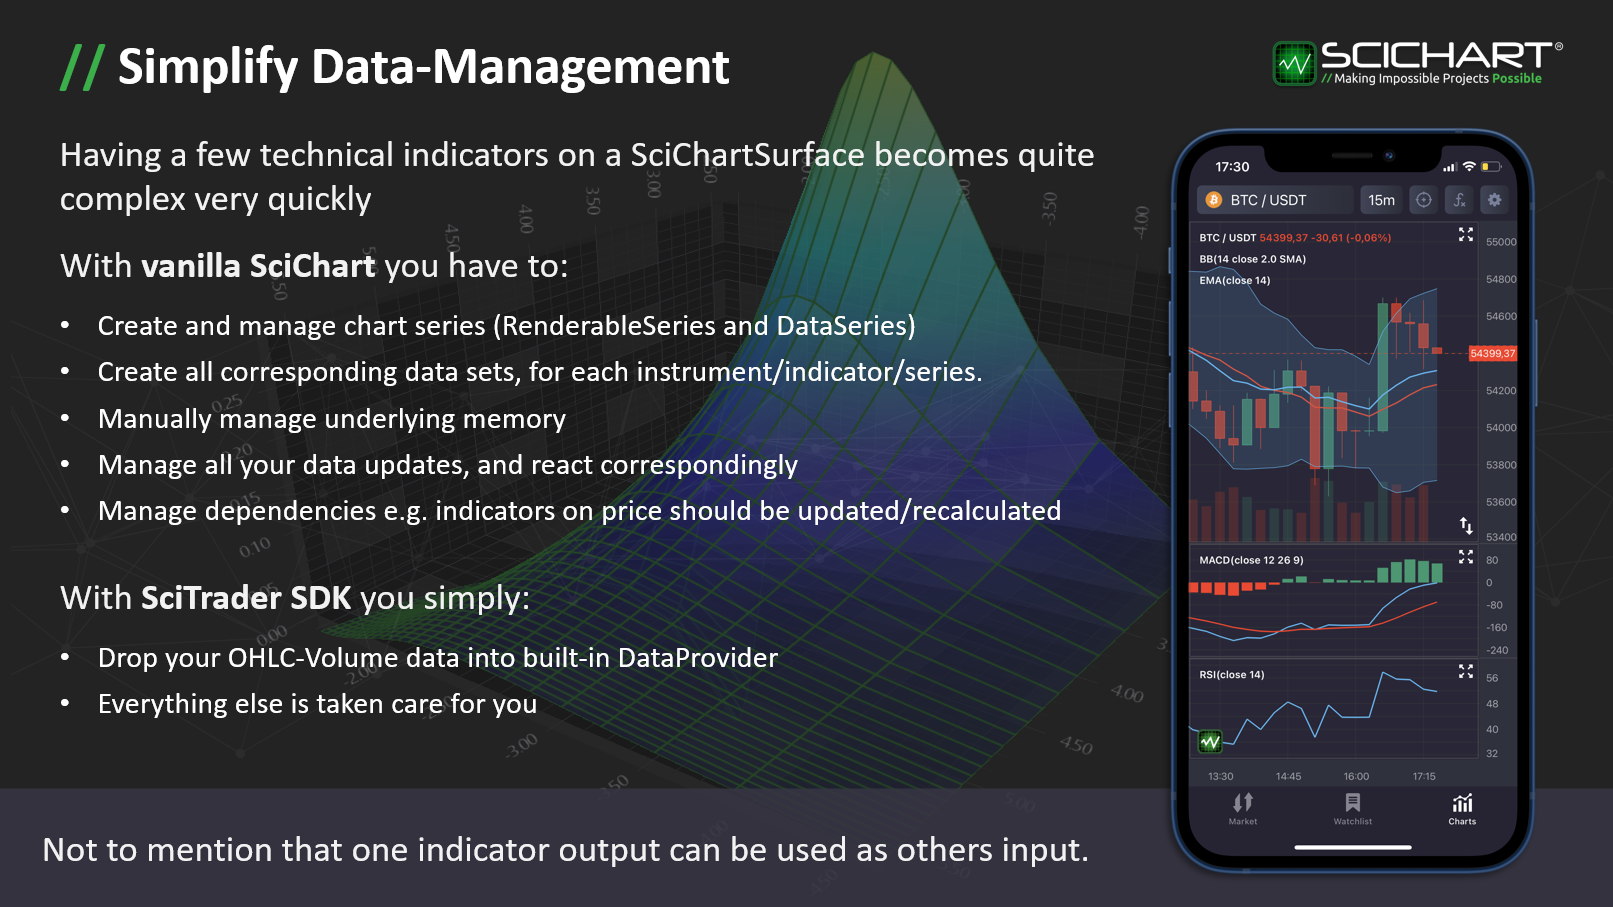
If you’ve used SciChart to create trading apps, having a few technical indicators on a SciChartSurface becomes quite complex very quickly.
With vanilla SciChart you have to:
With the SciTrader SDK you simply:
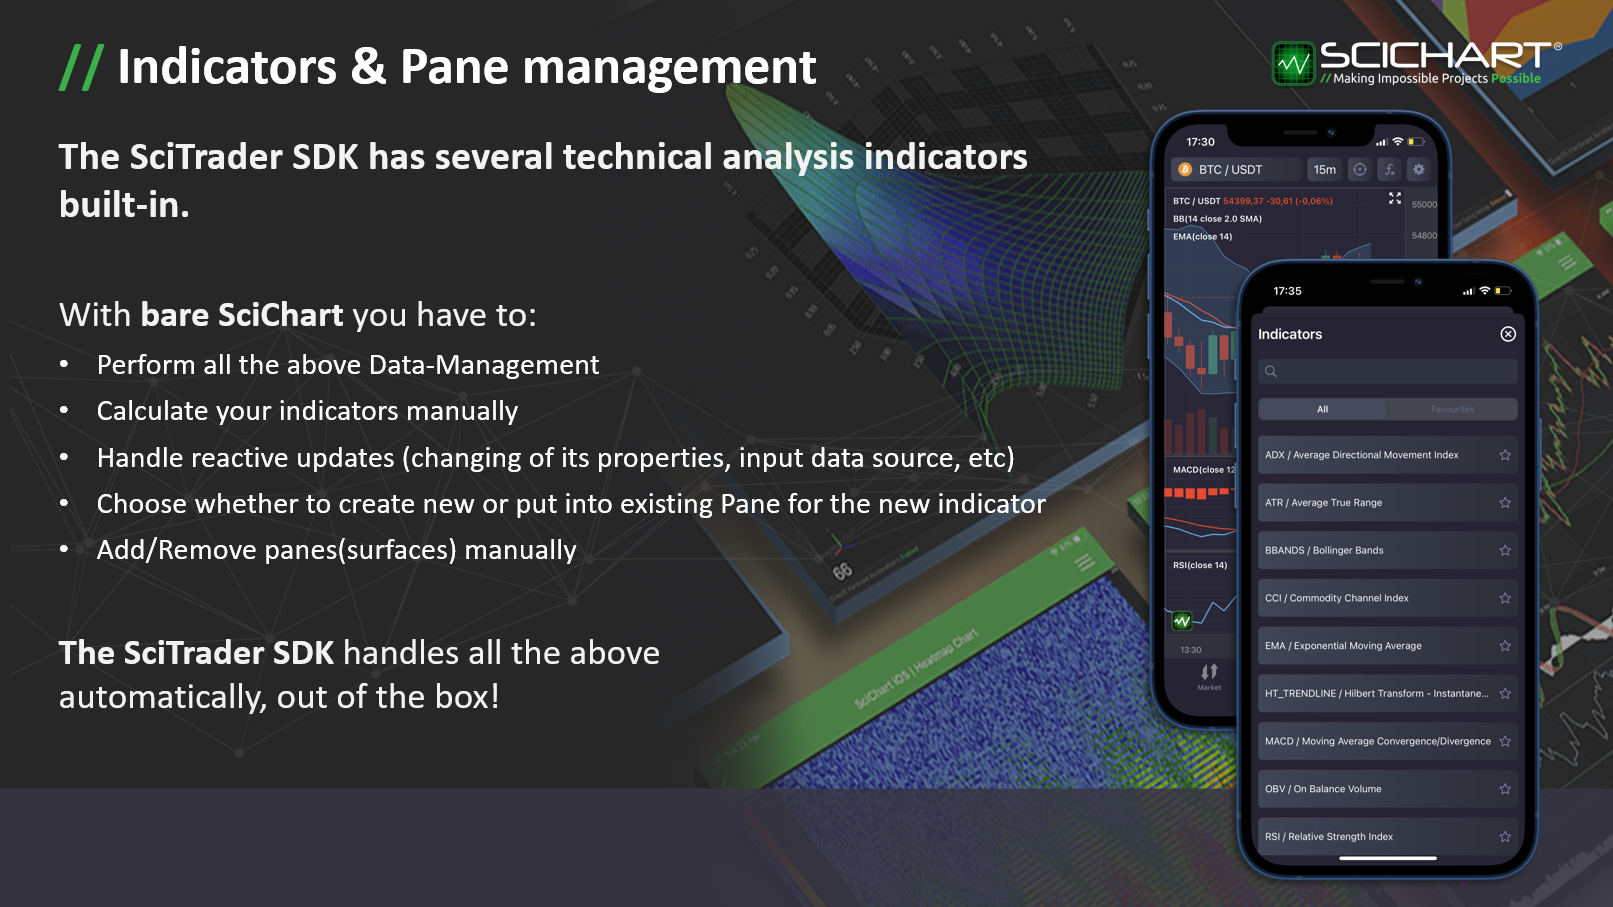
The SciTrader SDK has several technical analysis indicators built-in.
With bare SciChart you have to:
The SciTrader SDK handles all the above automatically, out of the box!
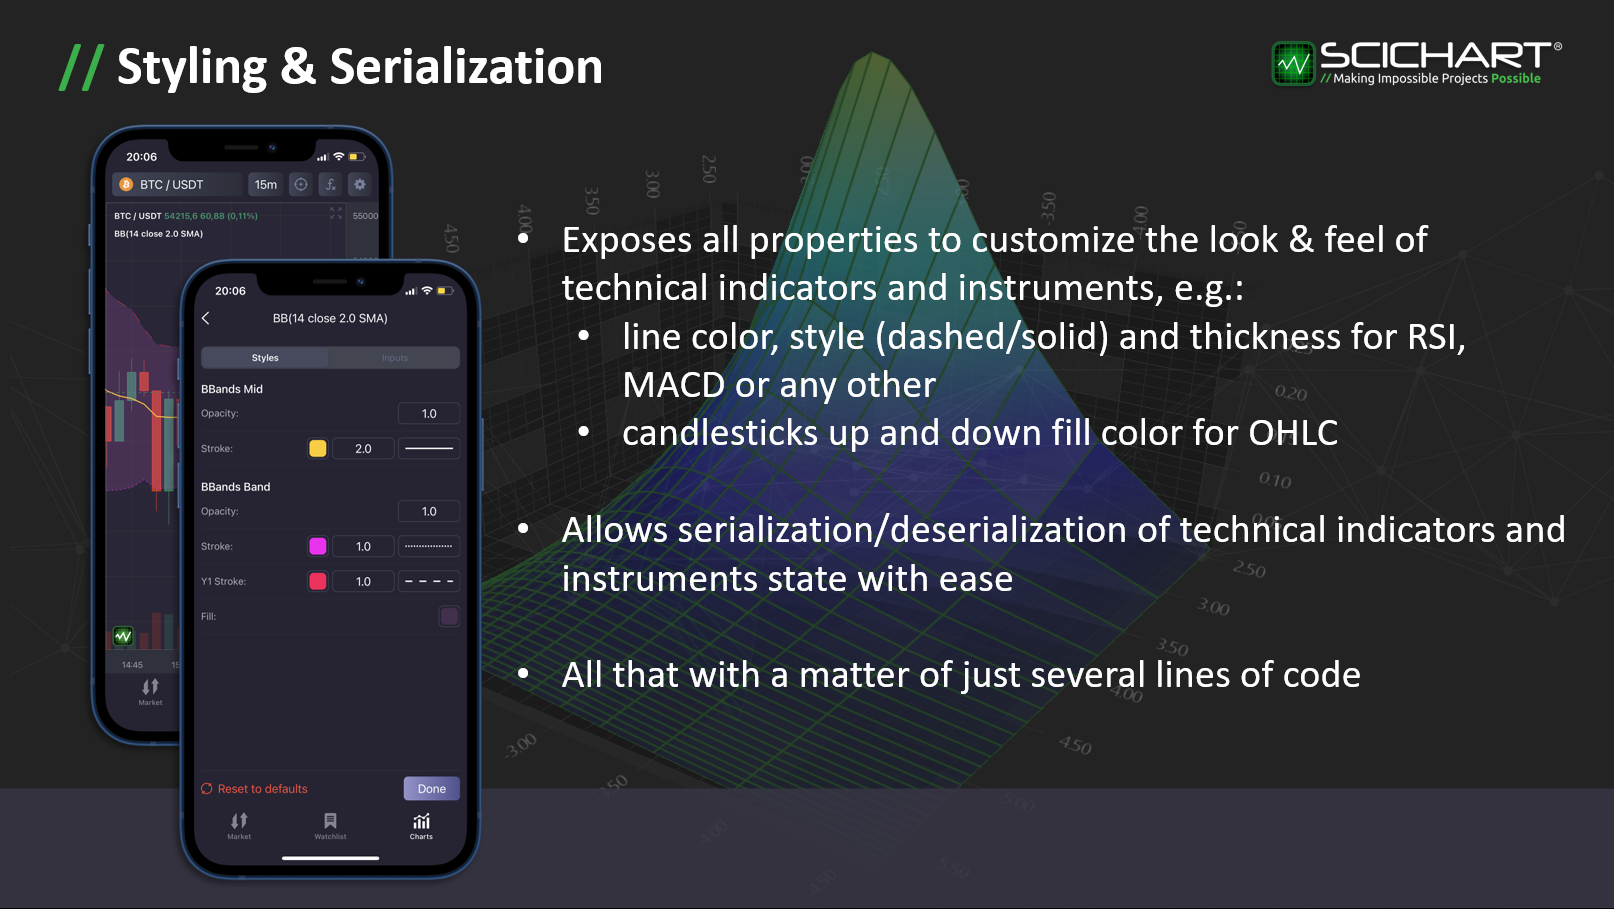
The SciTrader SDK Exposes all properties to customize the look & feel of technical indicators and instruments, e.g:
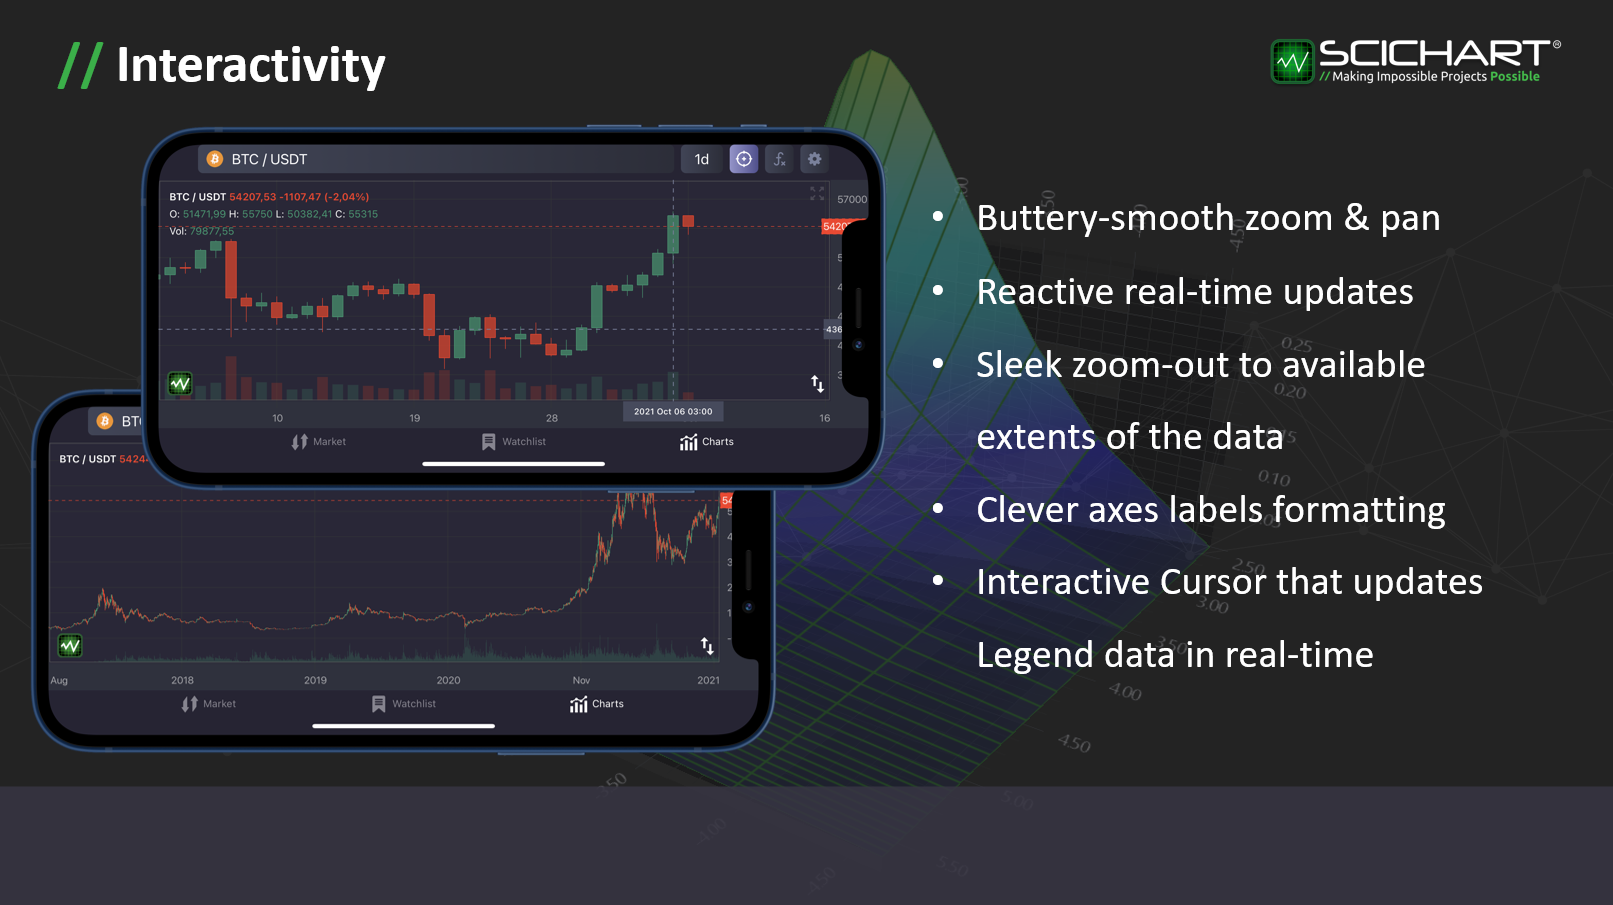
Thanks to SciChart’s powerful ChartModifier API, the SciTrader SDK features rich zooming, panning and interactivity.
That’s not all. We’ve also got a rich roadmap planned including drawing tools, saving & restoring chart templates, visualisation of trades, order books, custom proprietary indicators, and visualisation of trading through chart. Plus bringing our SDK to Javascript apps as well as native mobile.
With our new SDK you can quickly and easily create stunning trading applications with orders of magnitude less code:
With the SciTrader SDK, you can create rich realtime financial charts for exchanges, brokerages, or prop trading apps with hundreds of lines of code, not of tens of thousands of lines.
The SciTrader SDK will save you thousands of hours of development time and will let you get your app to market fast. This will save you a huge amount of time & money and let you focus on the important parts of your app.
Finally, the SciTrader SDK will be available soon for native Android (Kotlin) & iOS (Swift) and soon JavaScript.
To schedule a demo of the SDK from our sales team, get in touch!
The SciTrader App is free to download on the iOS & Android app stores.
SciTrader SDK is for sale for inclusion and white-labelling into your Exchange apps, Trading apps or Fintech / financial apps. If you are building an exchange, Fintech startup or trading app and want to learn more about pricing & licensing, Get in touch with our sales team!
Recent Blogs
![]()
Queens Award for Innovation
Proud winners of the Queens Award for Innovation, 2019. Awarded on account of our innovative graphics engine which underpins the SciChart library and enables our world-beating charting performance
![]()
National Business Awards
Highly Commended for Lloyds National Business Awards, 2019. Awarded on account of our innovative graphics engine and impressive customer base

Reviews
SciChart has received hundreds of verified, 3rd party reviews
Start a trial and discover why we are the choice
of demanding developers worldwide