Performance Optimisation of JavaScript Applications & Charts
I started programming a long while ago, in 1987 I wrote my first lines of code in Basic on a […]
At SciChart we are proud to support Innovation & Research worldwide. As part of an educational license program, we grant licenses in many cases for free, or at low cost to Universities for non-profit R&D worldwide. We have astounding list of over 145 Universities which use SciChart in their projects, including MIT, Stanford, Imperial College London and more. These projects have powered cutting-edge research and advanced the frontiers of science, using our high-performance, real-time charting libraries to visualise data.
We’ve taken a handful of the best student & University research projects to showcase in this article. For a look at what SciChart can do, and some of the incredible research, read on!
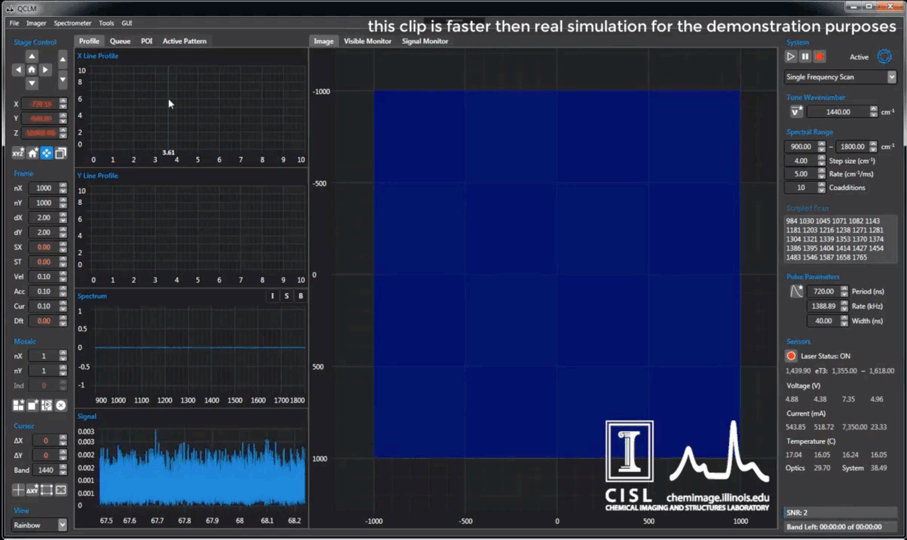
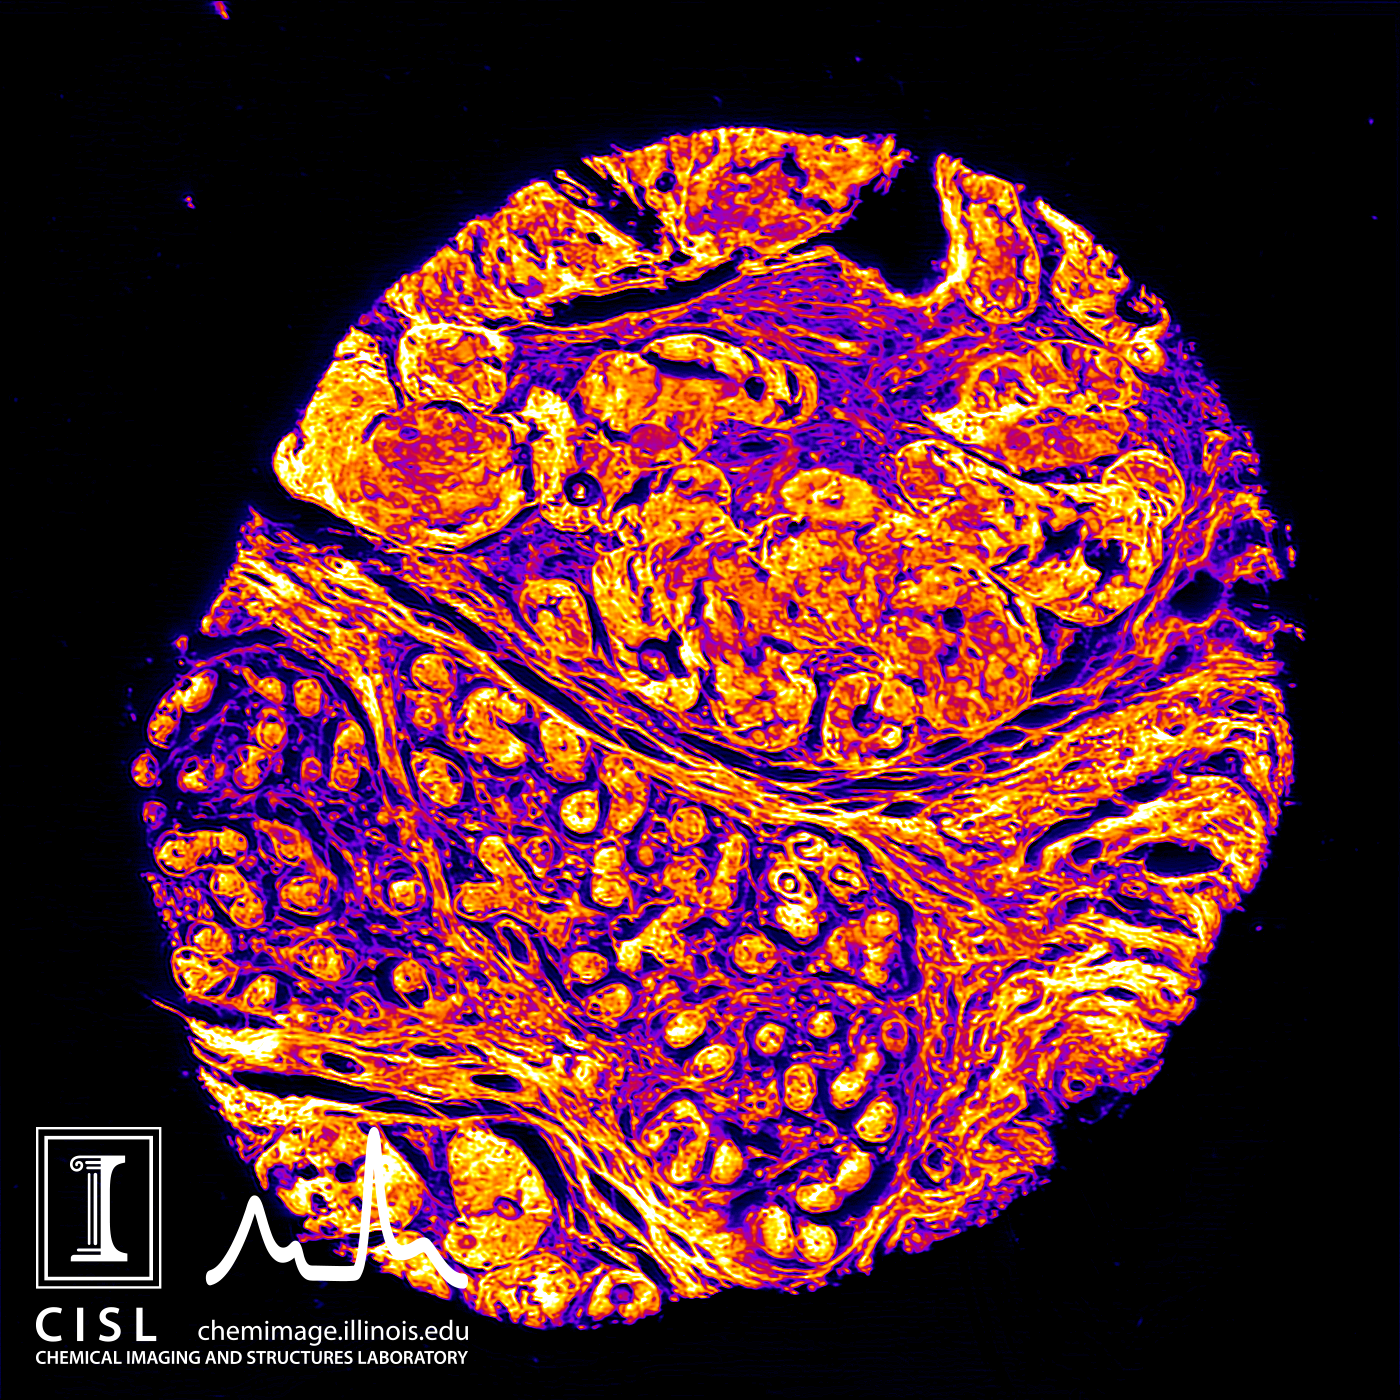
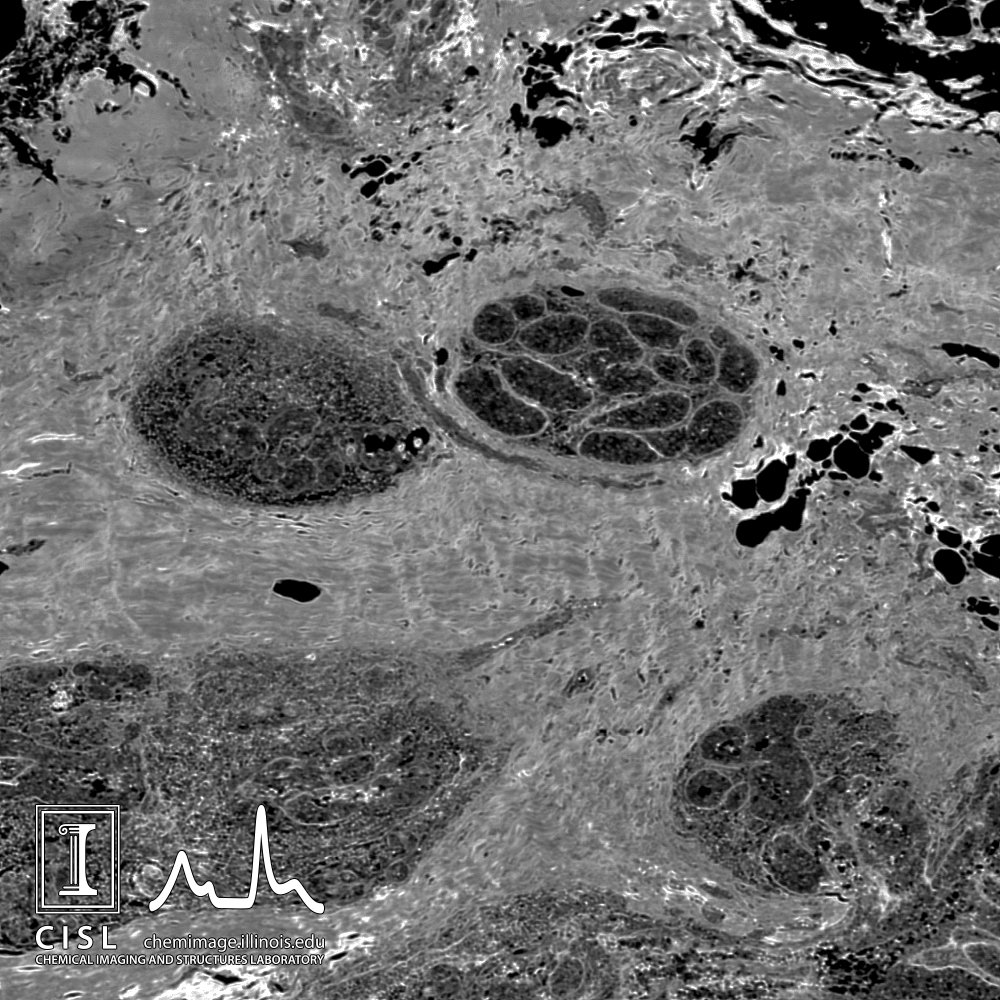
The University of Illinois departments of Bioengineering, Mechanical Science & Electrical Computer Engineering were researching alternatives to Fourier-transform infrared spectroscopy for use in Medical Diagnostics and methods being used for classification of tissue thin sections identifying tumorous regions.
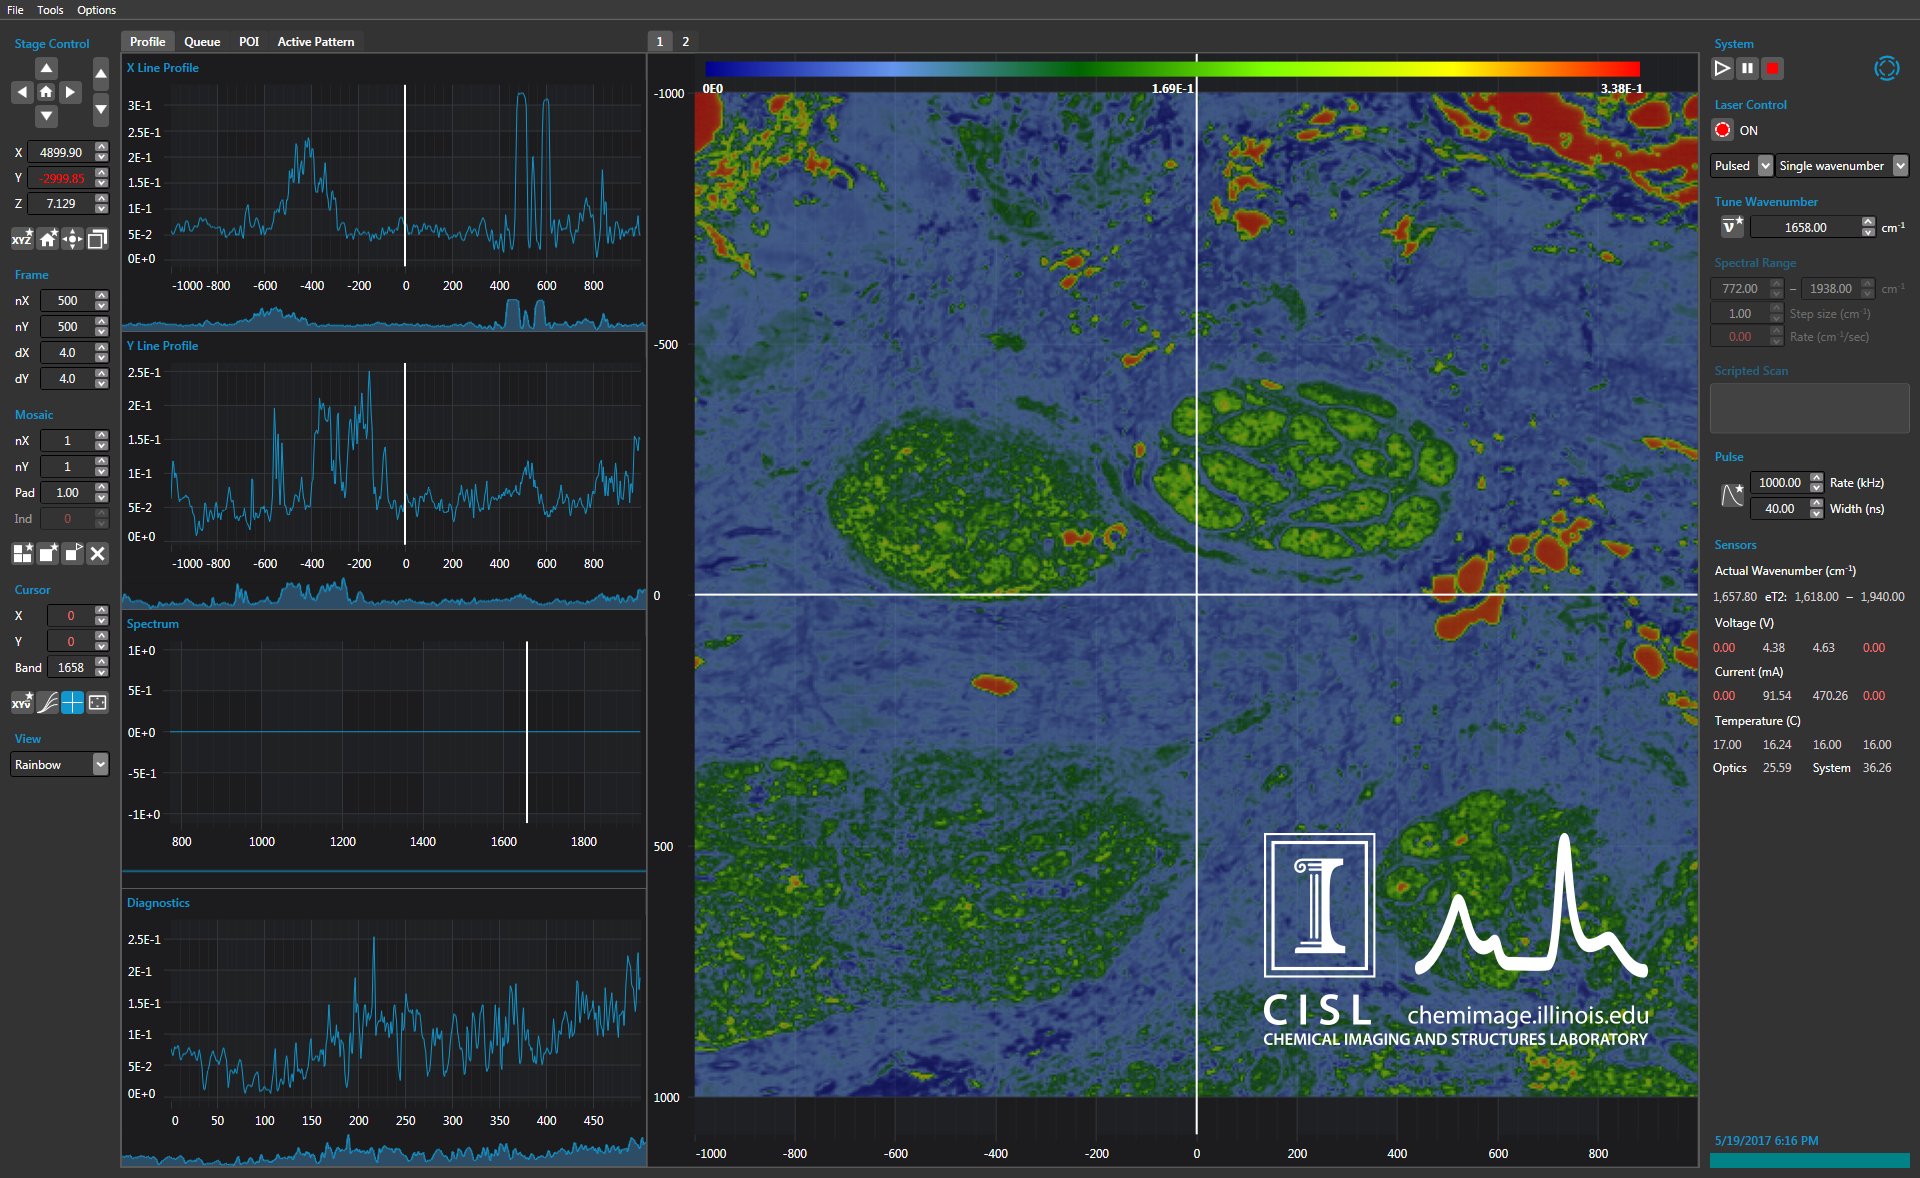
Despite exponential growth of the field and its world-wide research, the clinical sphere has been limited by data management. With over a 100 million data points generated in realtime, current imaging technologies were limited to less than 1% of the data set.
This study turned into the cutting-edge research project where SciChart’s WPF charting library is used to display Realtime High Definition Heatmaps from Quantum Cascade Laser (QCL) Infrared (IR) Spectroscopy.
SciChart helped with handling over 1 million points of data in real time with the capacity to increase to 10 million. This allowed the advent of HD Realtime IR imaging and reduced the screening time from weeks to hours. In this field time is indeed the invaluable resource.
Read also: Fast infrared chemical imaging with a quantum cascade laser
Revolve team from NTNU used SciChart’s High Performance WPF Charting Library to handle their complex data from over 300 sensors in their electric Race Car.
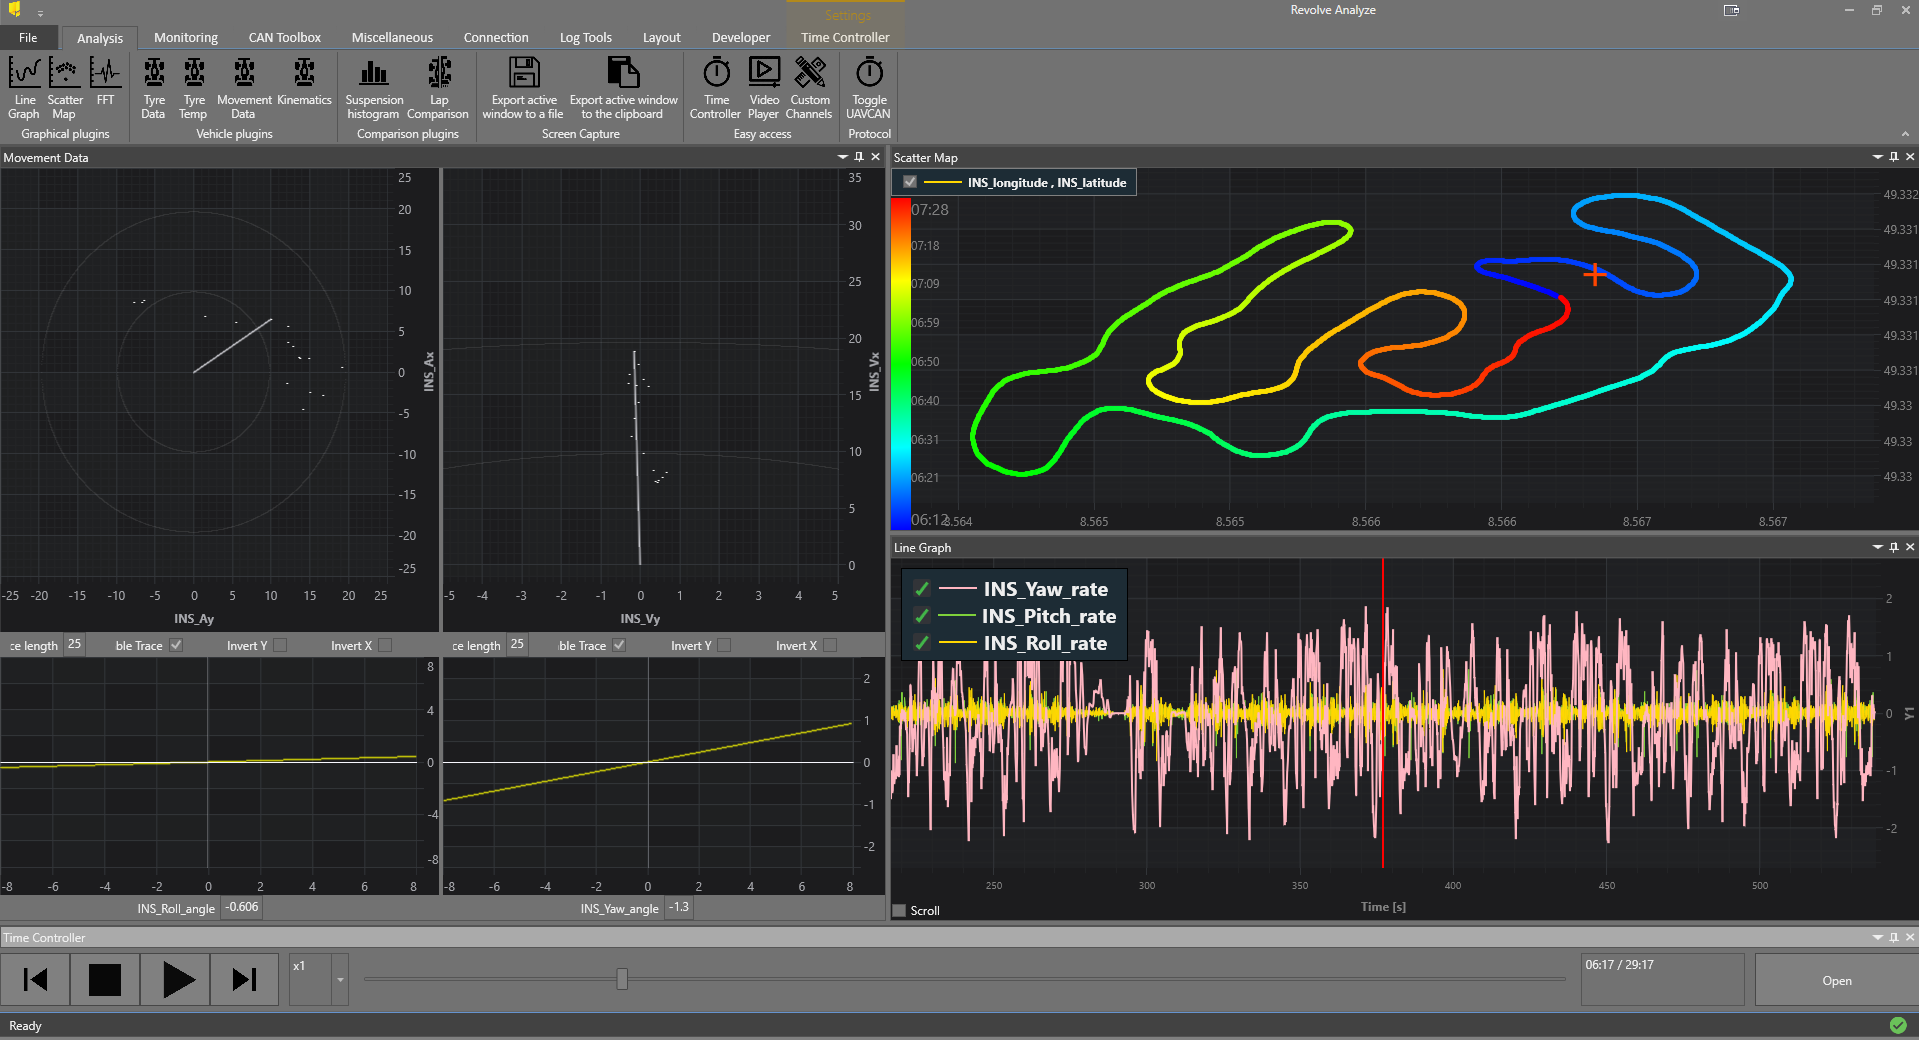
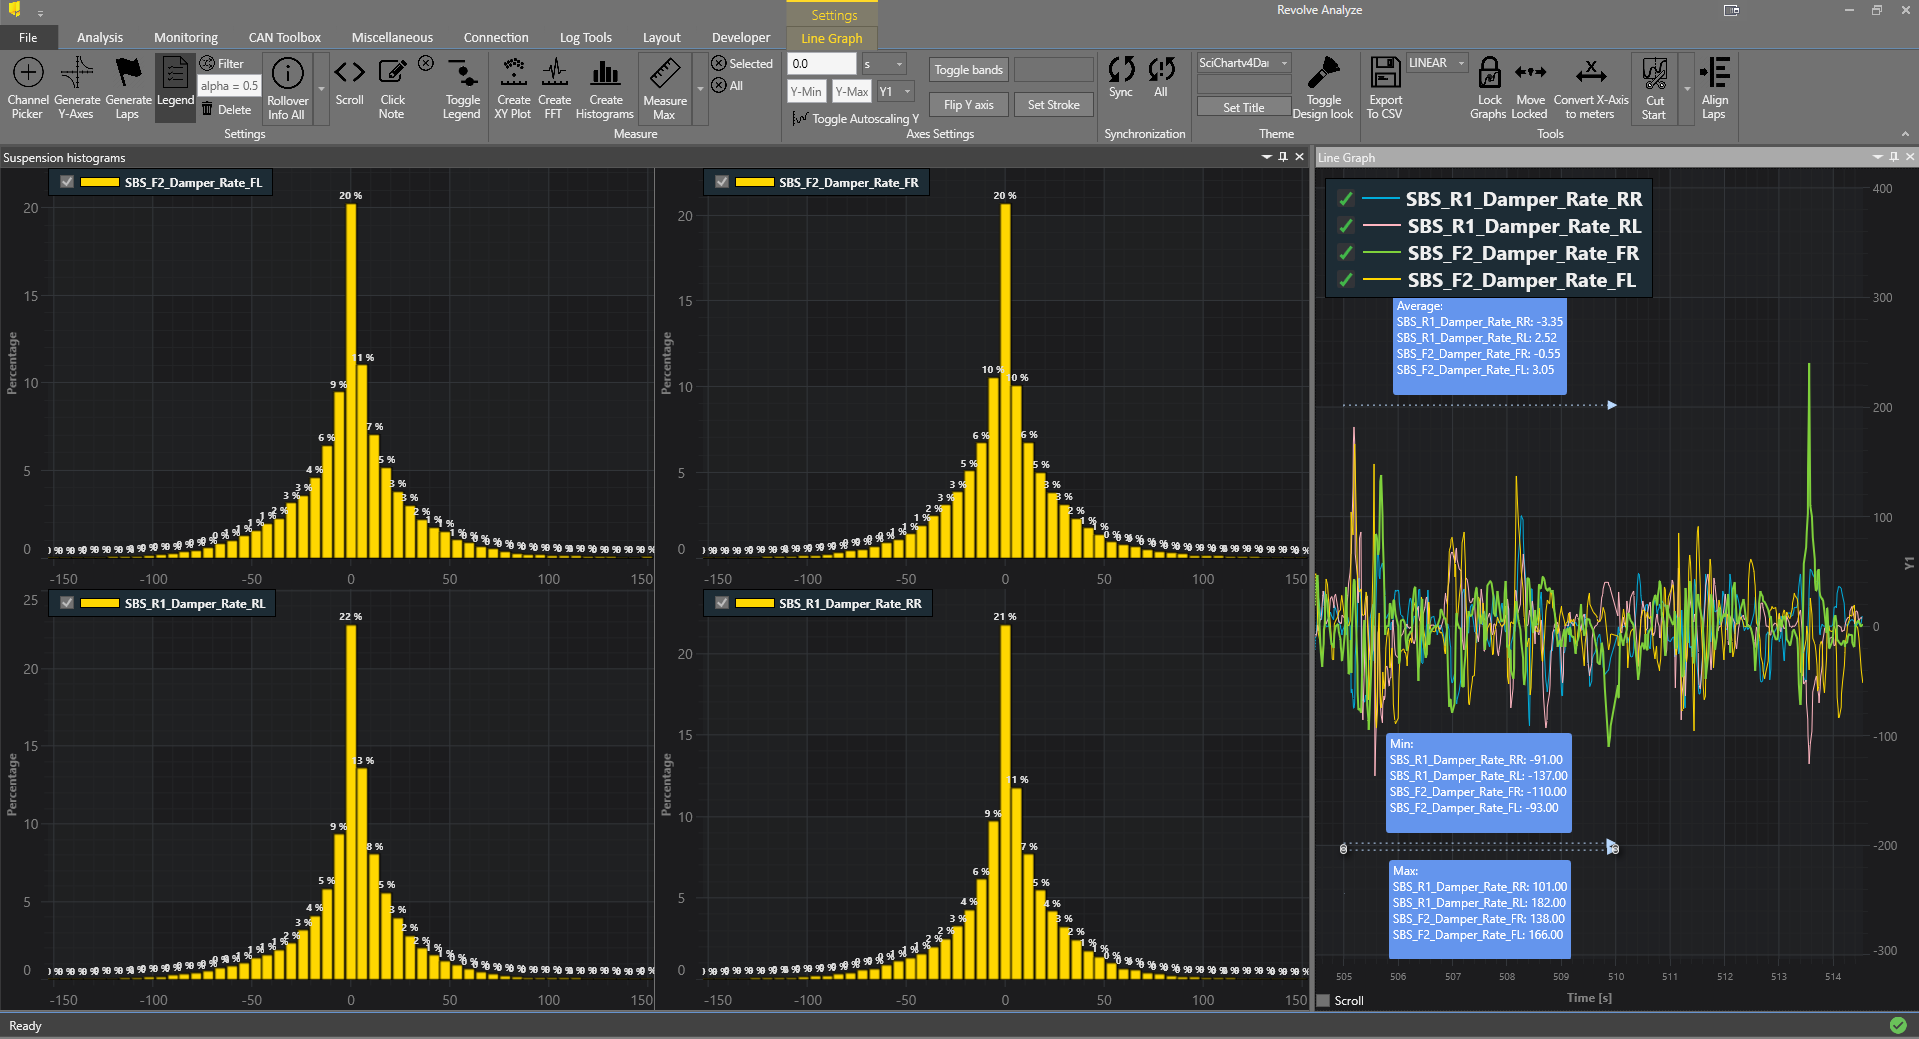
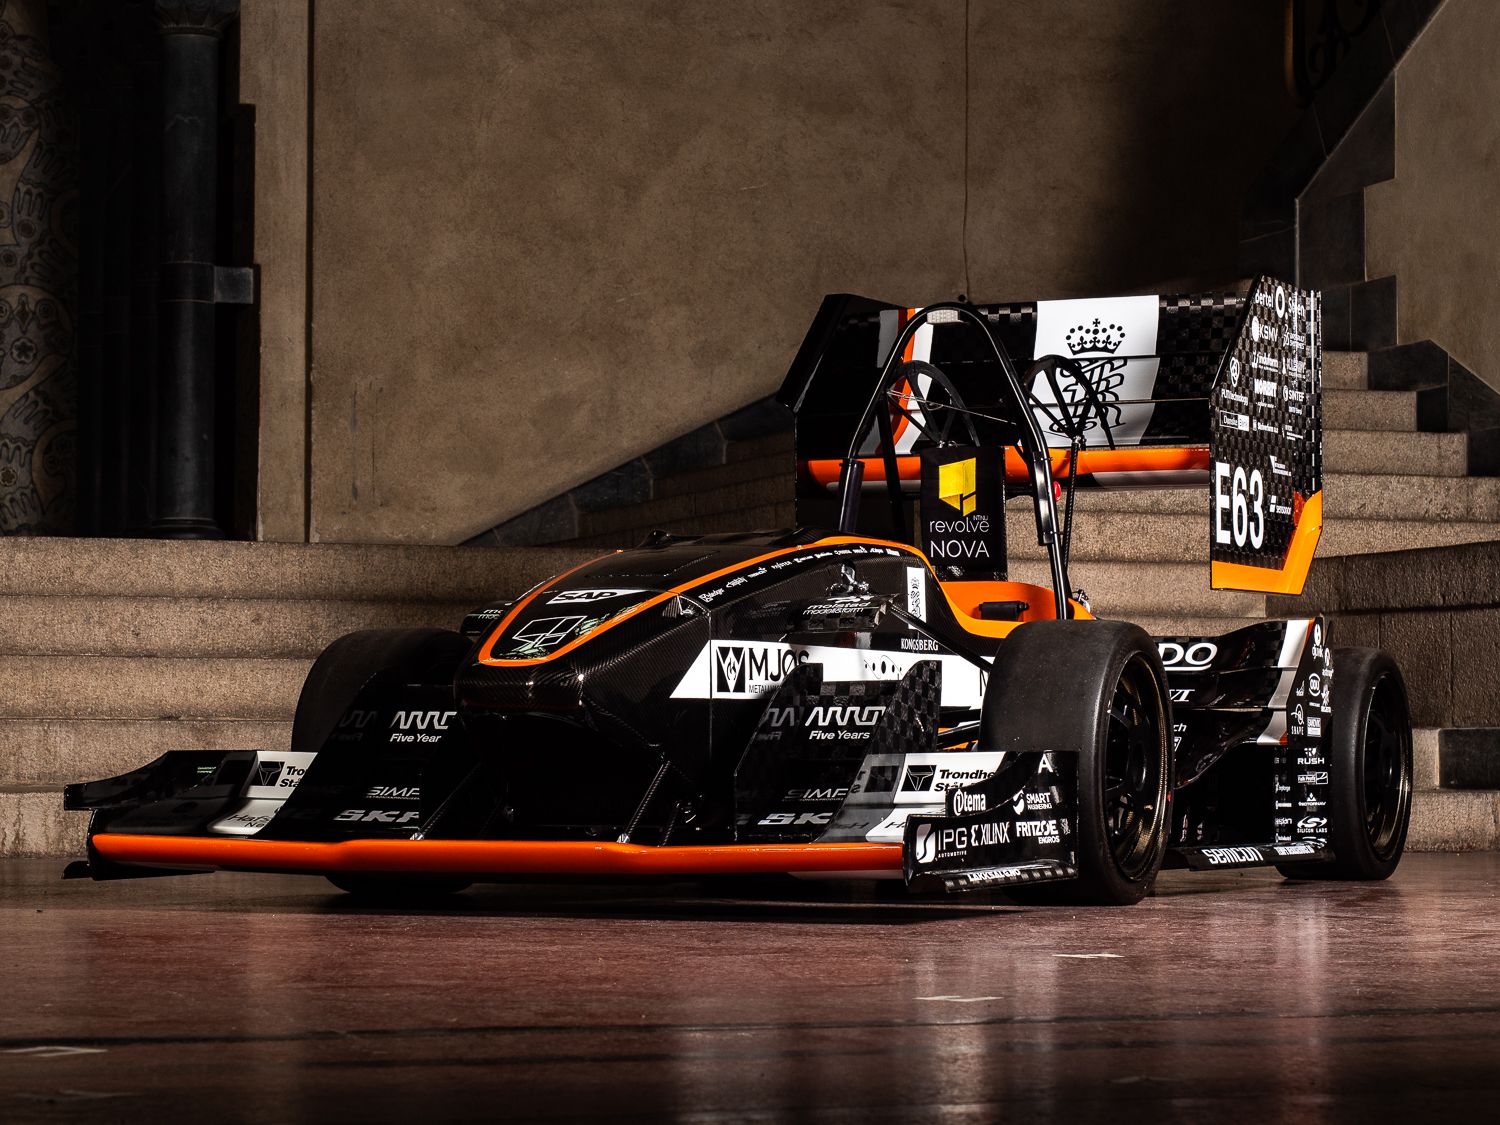
Revolve NTNU Norwegian University of Science & Technology is an independent student organization engaged in Formula Student, Europe’s most established educational motorsport competition. Creating new iterations of their Race Car each year, Revolve needed to be able to visualization their multi-stream, high-bandwidth data from their hundreds of sensors in Realtime to ensure top performance and allow for torque vectoring and testing of their car.
The charting library allowed the team to do performance analysis and testing, they are ranked number 10 in the world now and surely are some of the most talented engineering students in the world.
Read more: Revolve Official Website
A student from FH Joanneum University of Applied Science has developed an Android Application to record acquired sensor data via Bluetooth and to allow synchronization with the Empatica(E4) and Google Fit cloud storage solutions.
The E4 is a medical-grade wearable device that offers real-time physiological data acquisition.
Since there is no universal standard for data exchange the goal is to enable the researchers to conduct in-depth analysis from the raw sensors data visualised and exported. The SciChart Android Charting library was used to visualise the raw data received from sensors via Bluetooth.
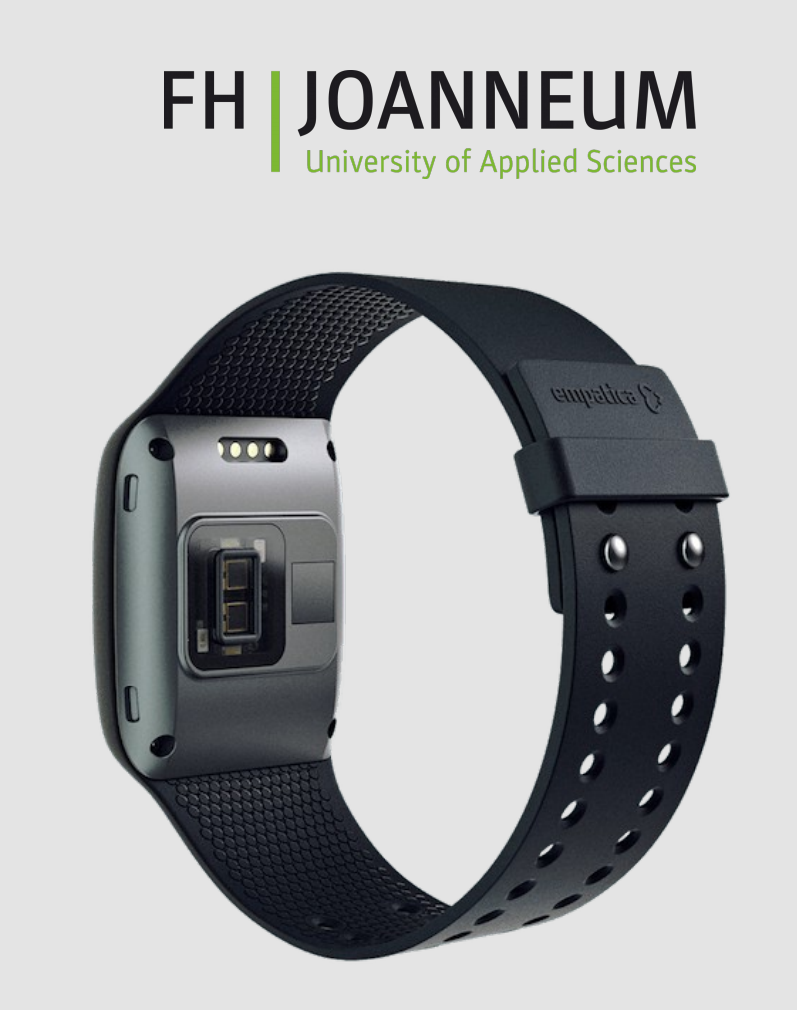
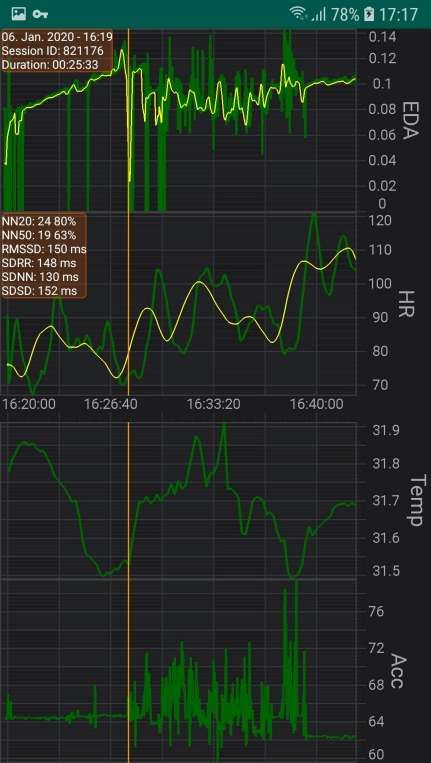
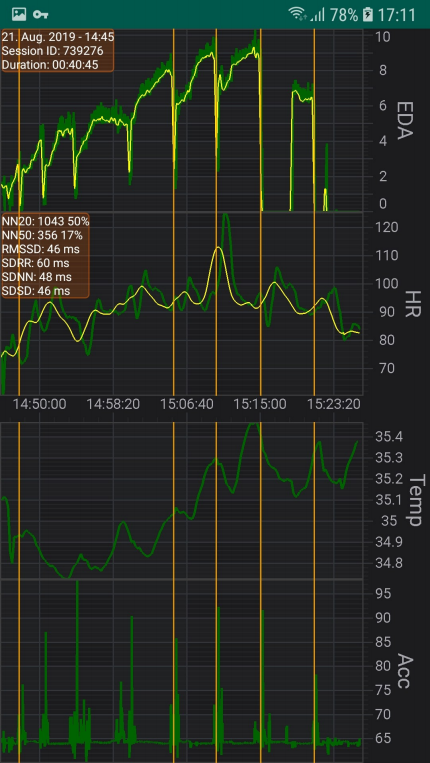
It measures blood volume pulse (BVP), from which heart rate variability can be derived. The 3-axis accelerometer captures motion-based activity. An EDA sensor (GSR Sensor) measures the constantly fluctuating changes in certain electrical properties of the skin. An infrared thermopile reads peripheral skin temperature.
As the result of the study the heart rate variability (HRV) was calculated using the interbeat interval between all successive heartbeats.
Needless to say, that the implications of the personal health devices can increase diagnostic accuracy, enhance physician efficiency and allow more convenient data collection.
Read more: Project on GitHub
See also: Article on Whole-Night Sleep EEG Revealing Distinct Deep Sleep Stages with Differential Electrodermal Activity
A student at Vellore Institute of Technology, Vellore as a part of Cardea Labs & Cardea Biomedical Technologies Pvt. Ltd team had a challenge to create a low-cost non-invasive healthcare solution for the clinical needs of India and the rest of the world. It had to be an affordable portable ECG device that could achieve medical grade clarity, therefore the challenge was in the reliable realtime data visualization with smooth interactions.
SciChart’s WPF extensive charting library was used to create the FIFO functionality required, which generated a Realtime scrolling ECG monitor. The chart is dynamically updating at 250 points per second with data acquisition through Bluetooth connection for an ECG device derived from the miBEAT hardware platform.
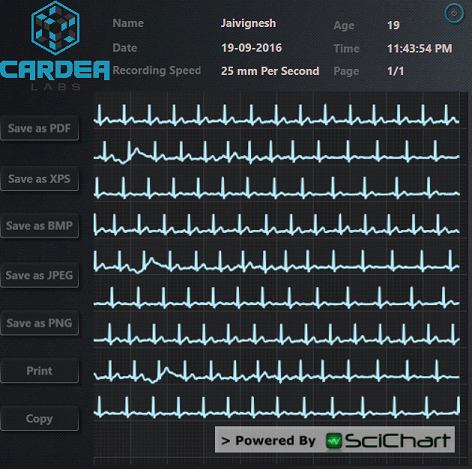
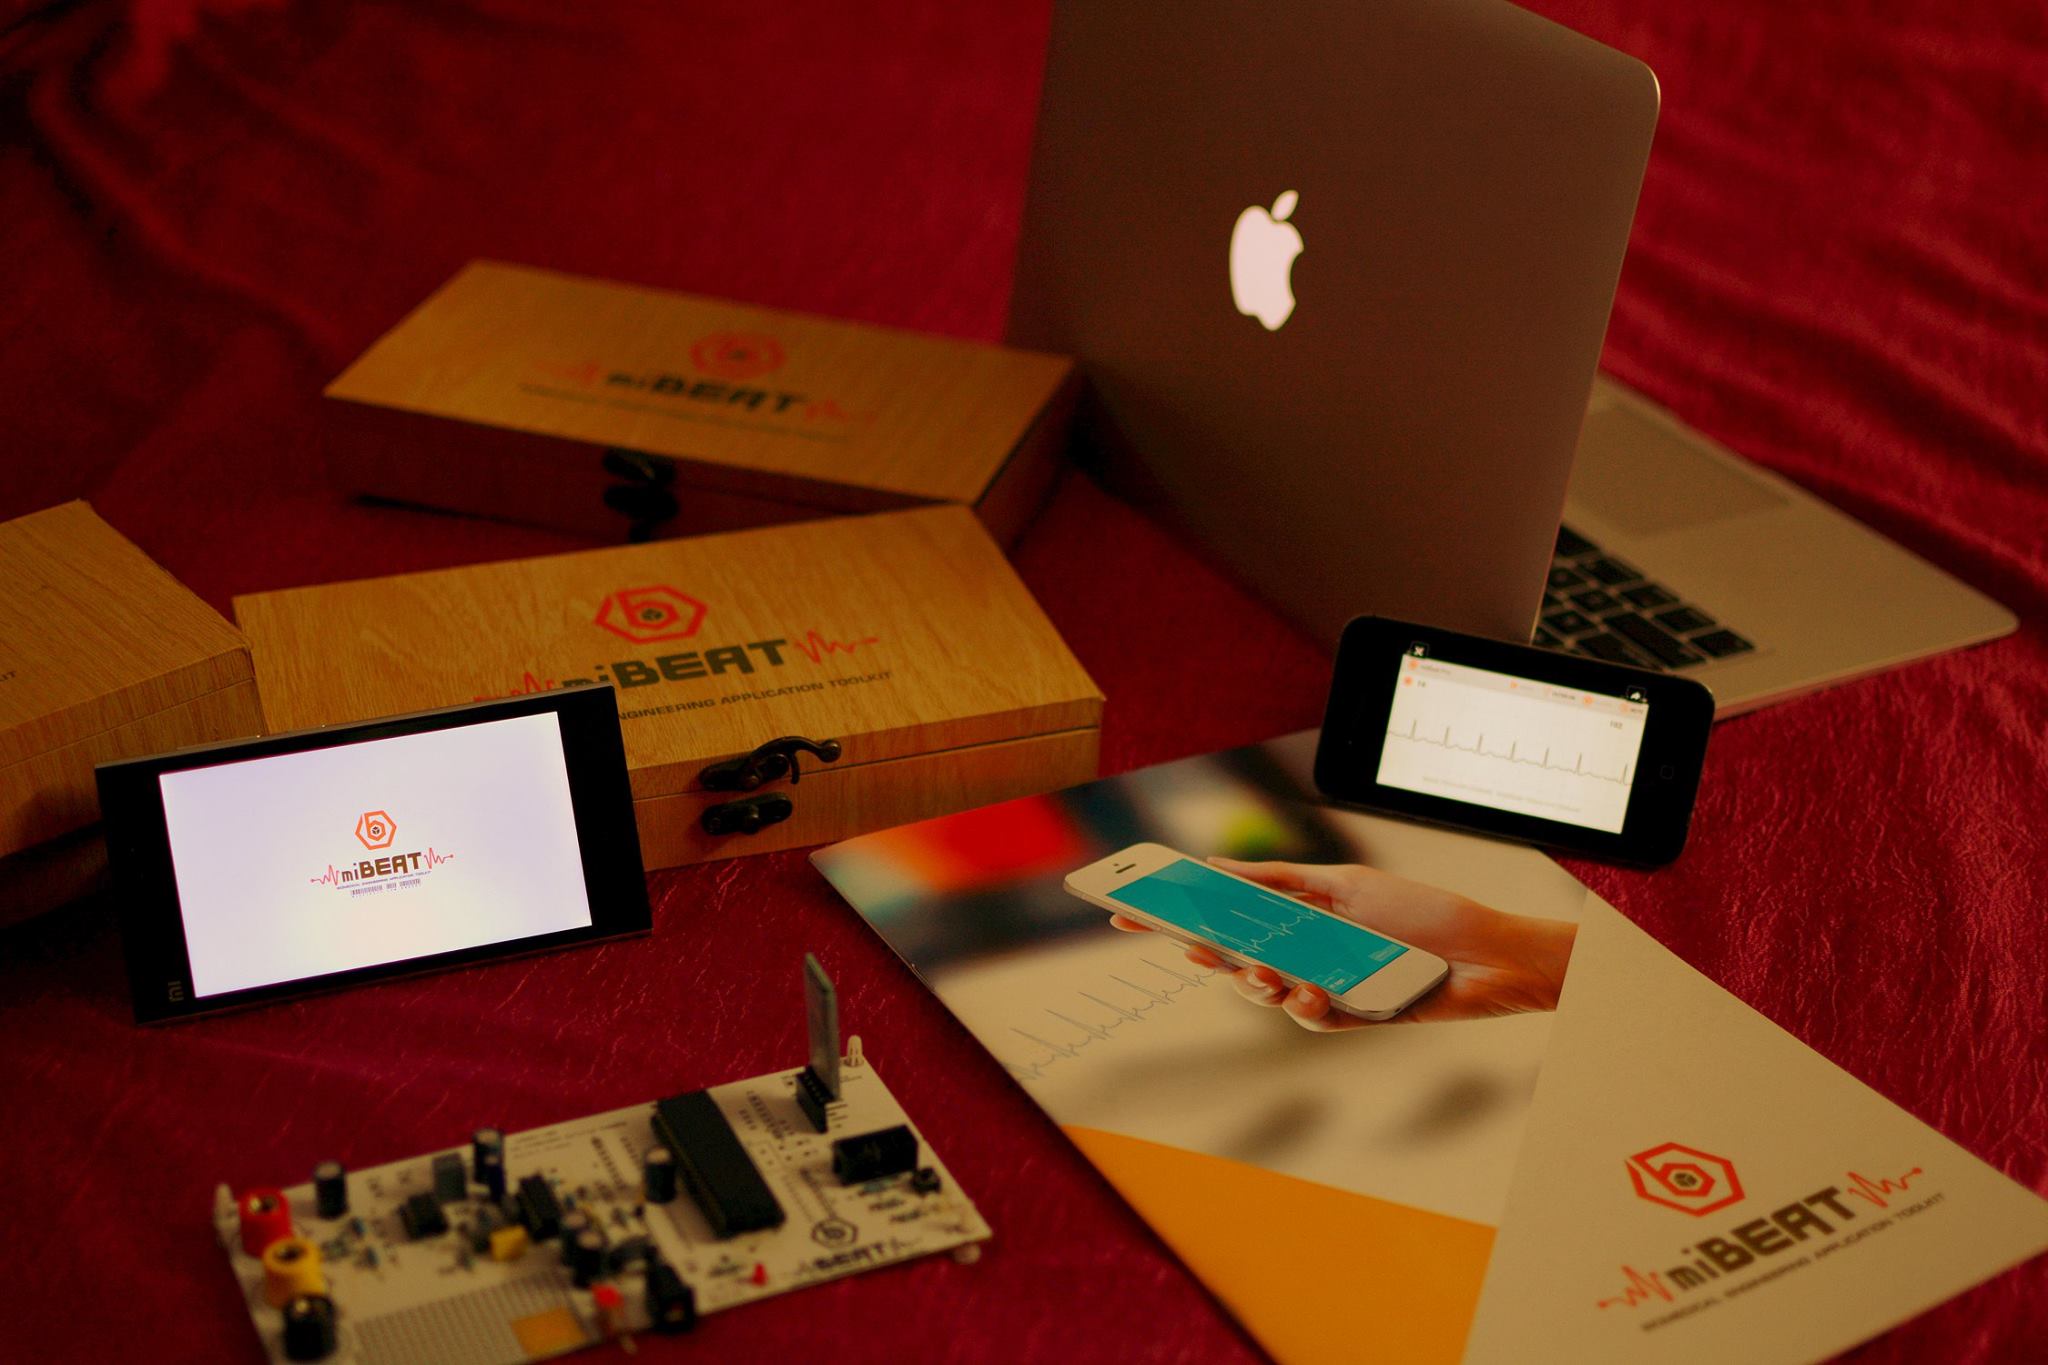
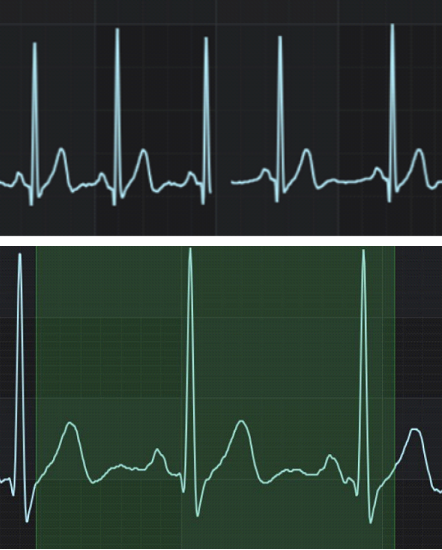
This was combined with export function that allowed users to export in numerous formats, so the data could be collated outside of the application. The session window allows to Pan, Zoom & Scroll making the UI intuitive and user friendly, all this being used on smaller portable devices.
Read more: Article about miBEAT project
My students’ years were enriched by being a part of Students’ Organizations. I was a member and a leader of a local group of the Board of European Students of Technology – a non-profit organization with the mission to empower diversity. I also joined the Enactus team at Graceland University during my exchange year abroad program. Enactus is an organization has the vision to create better more sustainable world. These experiences shaped me and my career as it is now. This is where I gained my skills to land the first job and my drive to progress at what I do.
I am happy to work at a place that supports students as much. SciChart has an academic free license for the students’ university projects and research. SciChart is an innovative company at its heart and investing into students, who have the spirit and unstoppable willingness to make a difference gives us an interesting mix.
Learn more about SciChart Educational Programme.
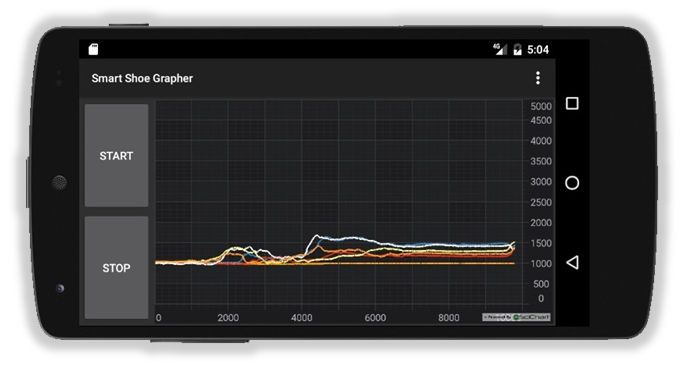
MIT Biomimetic Robotics Lab used SciChart for Android to display and interpret Realtime telemetry data from Smart shoe sensors designed to capture measurements of force-data during movement.
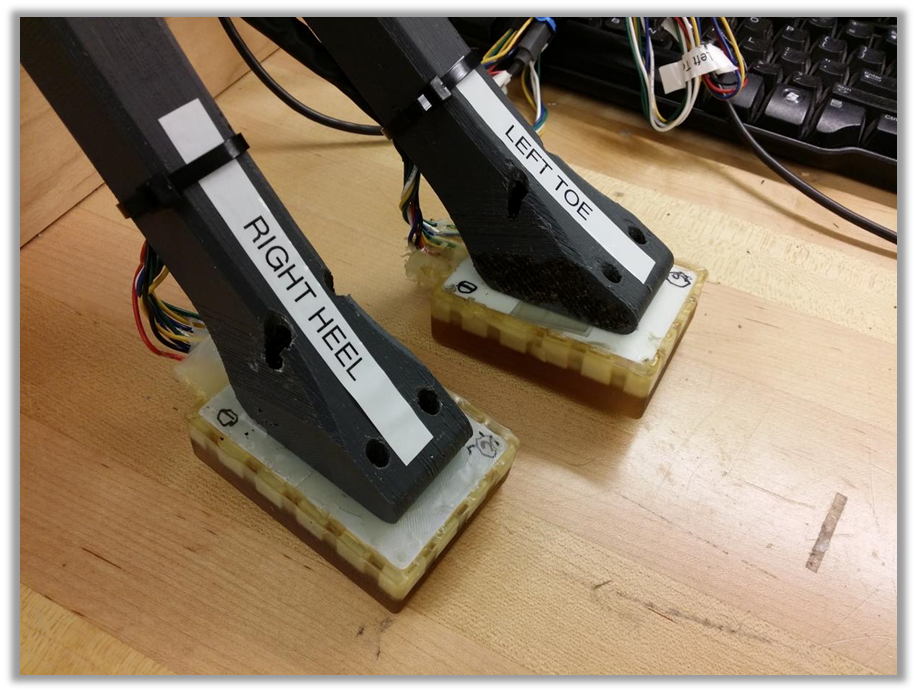
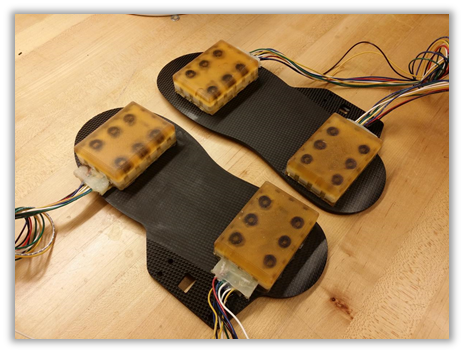
Organic organisms contain an abundance of surface skin sensors that can determine pressure, vibrations and forces which in turn feedback and allow calibration of movement. The Biomimetic Robotics lab at MIT aimed to develop a similar multi-axis force sensor for use in the next generation of legged robots by mapping the local sampling of stress inside their custom polymeric footpad.
SciChart’s Android charts were used in the application for reading and visualising multiple streams of data at 1kHz amounting to hundreds of thousands of data points, collected from smart shoe telemetry.
The team’s goal is to use these force sensing shoes not only in robotics, such as the famous Cheetah Robot, but also to help assist the elderly and disabled during walking for fall prevention and mitigation as well as to provide athletes with training data.
Find more case studies here: Desktop Case Studies, Mobile Case Studies, Consultancy Project Case Studies.
p.s. Interesting, that the sphere where students’ projects have been performed align perfectly with the domains of commercials SciChart customers, including 60% of top global semiconductor companies, 80% of global MedTech, 80% of top US Banks, All top F1 Teams, Top Global Petrochemical companies and thousands more.
p.p.s.Vrije Universiteit Amsterdam, ranked in the top 100 of global universities is now teaching SciChart to its computer science students in the construction of real time applications. SciChart is being taught at several leading educational establishments meaning that our software is being used to train the next generation of the workforce in cutting edge technology.
Recent Blogs
![]()
Queens Award for Innovation
Proud winners of the Queens Award for Innovation, 2019. Awarded on account of our innovative graphics engine which underpins the SciChart library and enables our world-beating charting performance
![]()
National Business Awards
Highly Commended for Lloyds National Business Awards, 2019. Awarded on account of our innovative graphics engine and impressive customer base

Reviews
SciChart has received hundreds of verified, 3rd party reviews